This article aims to detail that basic ways that we develop software at SMOK sp.z o. o. You might also want to read another article about SMOK, namely SMOK – a study of a case.
What is SMOK and why is the example important?
SMOK is a company that’s been founded around 2018 by two accomplices of mine and me. It aimed to sell a solution that I’ve been working on for at least past 10 years, namely a solution that would allow you to connect your boiler to the Internet and speed up notifications about a say boiler failure to someone that could fix it.
Up to 2018 SMOK was developed as part of a service company called DMS, so they basically had a product that allowed them superior control over their installations. If something broke, the system would detect it and expedite notifications to people who could actually fix stuff, because you don’t need a system telling you that your stuff is broke unless you also happen to have someone on the payroll that can act upon this notification and fix your stuff.
And why do I feel that it’s important? Because we manage to keep at least 2500 installations around in Poland around with a 1,1 FTE of IT support. This FTE also includes all the customer support. We write new features using an intern, who nevertheless delivers high quality code, and we have a full CI/CD pipeline including rollbacks, a centralized logging system, metrics and tracing as well (basically the holy trinity of observability).
The entire system computationally-wise fits on a single 48 vCPU virtual machine, and every connection with the boiler is secured with 128 bits of cipher. The fact that it’s been done for peanuts it’s important, because this means this particular way of doing IT succeeded.
How does the system and code architecture work?
For CI/CD + repository tracking we use GitLab. There are two branches – master (the production releases) and develop – the staging release. This corresponds to two environments that there are.
Basically everything runs Docker – we have a root (smok5/runtime) images that our services are built off. This includes the unittest variant. Seeing as most things run Python there’s a root repository called smok5/runtime that has code that will be useful in developing SMOK services, such as a Cassandra access, our own Python AMQP client (that runs load tests as part of it’s release) + an unified way to parse and understand configuration, and a single way to emit logs/metrics/traces.
Now, there’s two ways to “compile” the repository of smok5/runtime:
- As a Docker image – you’ll end up there with either a service base image or a unittest base image. The service base images are used to construct active SMOK services, whereas the unittest variants are used to run unittests.
- As a Sphinx repository- this will later host it’s contents with GitLab Pages.
smok5/runtime also provides a tool called smok5rtti. This is both a service builder using ONBUILD directives and a tool to launch your processes. So basically in case of SMOK services the executable that runs first is the smok5rtti, and the service that launches (your service) is the second. If your process aborts with a non-zero return code, all of the stack traces that can will be collected and be mailed to a particular Google group. It also checks the container’s health state (that part was actually written in C for speed) by a simple test – if a nonhandled exception was suffered in any part of your service, it’s unhealthy.
smok5/core
Of course just plain libraries sounds little fun, so there’s a most significant in terms of CPU usage repository called smok5/core.
It serves as a data access layer to system’s Cassandra as a gRPC server. It has a couple of proto gRPC files, so even if we suddenly decide to go with Rust, we got our bases covered. Now there’s three ways you can compile this repository:
- Run python setup.py bdist_wheel – this will compile smok5/core onto an installable wheel, that can be installed in other services that need access to what SMOK provides in terms of objects – boilers, their setpoints and so on. This library will allow you do define SMOK objects in term of Python objects.
- Build it as a Docker image- you’ll have a gRPC server ready to handle all of these requests.
- Build if as a Sphinx repository – you’ll have full Sphinx-generated documentation available for this package. As far as I know, this makes it redundant to scour the files themselves for documentation, at least that’s what’s been working out for our intern. The build HTML files will be then hosted using GitLab Pages.
The repository is installable as a wheel by utilizing a piece of smok5/runtime that “knows how to build your application” as well as knows how to run it. You just add a repository along with it’s URL and private access token and bam – it’s installed as part of smok5/runtime’s ONBUILD.
How do unit tests and the boilerplate look like?
As I mentioned before, I’m a huge opponent of mocking half the universe, instead preferring to bright whatever I can to those unit tests standoffs.
If you really wanted to start writing a SMOK service, you’d need a particular directory setup. You can obtain that by cloning a repository called smok5/scaffold.
And how do the unit tests look like you might ask? We’ll they’re docker-compose files. These Docker-composes bring forth databases build as part of smok5/runtime, namely a Cassandra and a RabbitMQ. Since Cassandra’s notorious for slow startup speed, there’s a Python package (also available as part of smok5/runtime’s unittest variant) called wait-for-cassandra.
Since the Docker revolution you can bring pretty much anything to become a part of your unit test’s landscape. I’m not sure that these tests can be considered to be pure unit tests anymore, and I just don’t give a damn about that. I’m not mocking Cassandra’s functionality anyway. Everything’s done as part of docker-compose.yml file, also marked by coverage’s keen eye. Your pipeline should have code coverage computed as part of it, even as GitLab gives you actually tools to do it.
And if you need a smok5/core gRPC server, there’s a unit test variant of it built as part of it’s release. You just specify another service in your docker-compose.yml and that’s it.
The database part
The core database for SMOK is Apache Cassandra. It was chosen for being completely peer-to-peer, and I just don’t like master/slave based solutions. This allows to partition SMOK onto three machines, and if any (arbitrary ones) fails, SMOK will continue to operate. It also solves all of the scalability issues, ensuring that SMOK will scale in O(n). Pretty nice, eh?
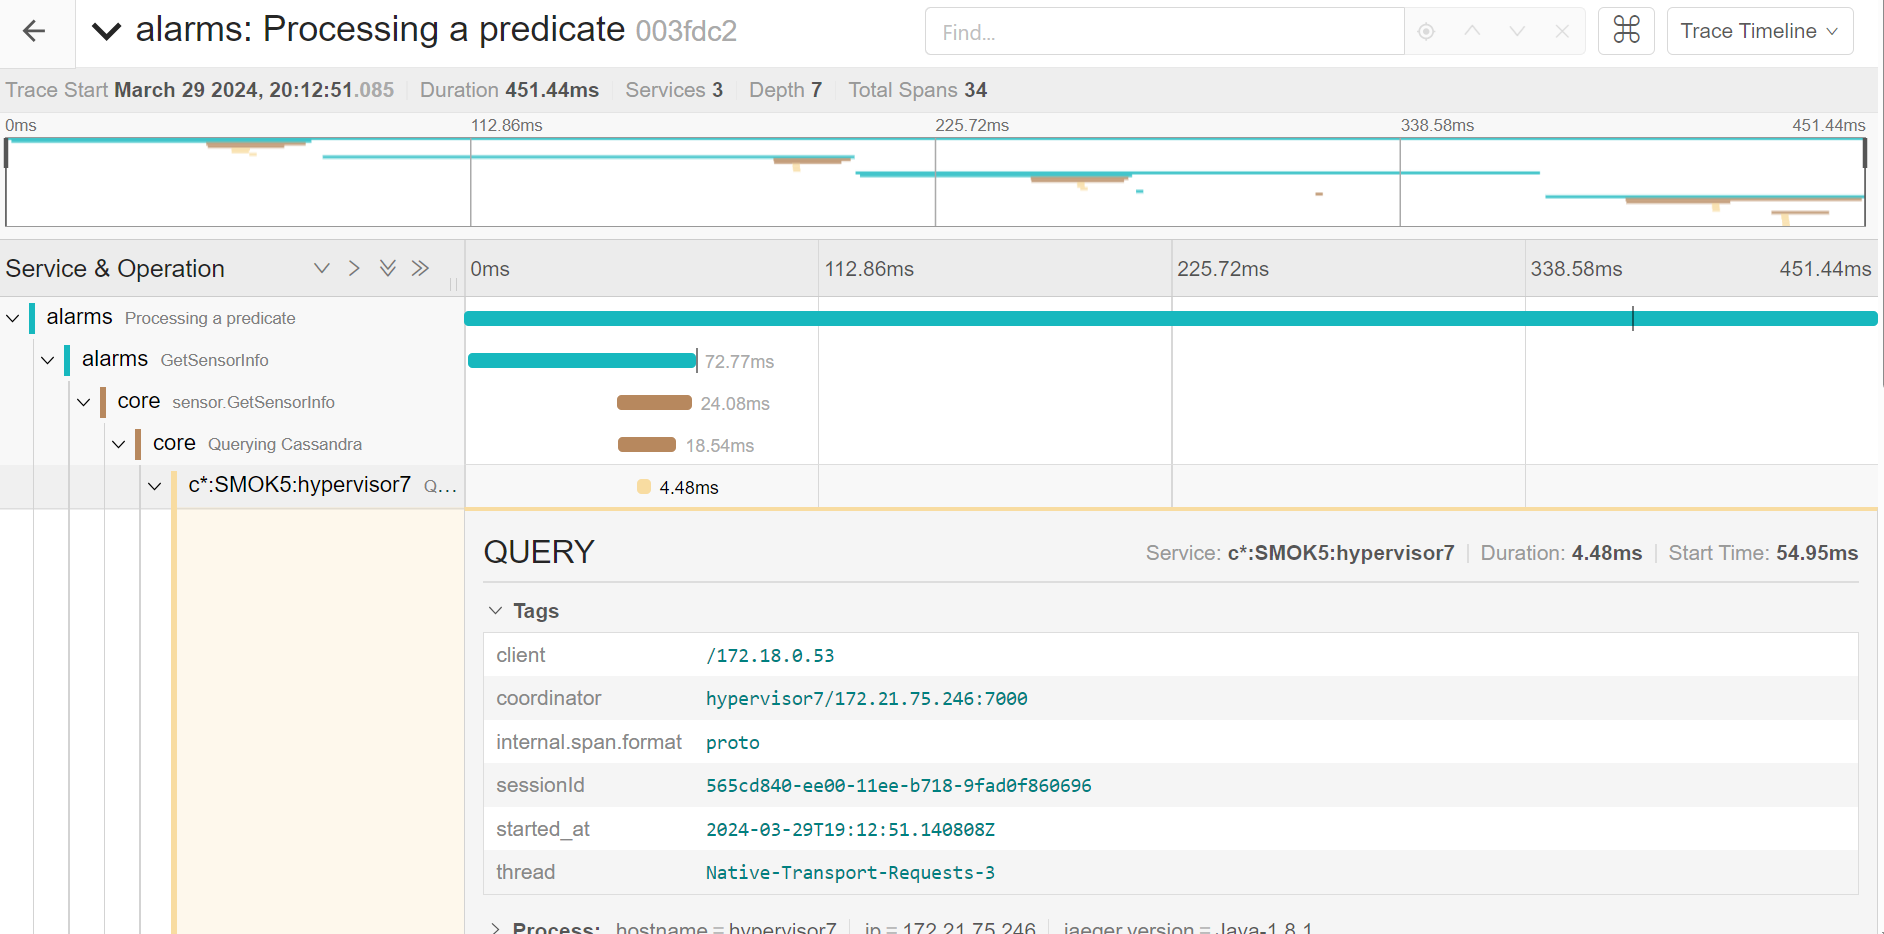
Also one reason to use Cassandra – you can actually trace it and submit whatever the database’s been doing to Jaeger. This is the reason we took active part in cassandra-jeger-tracing’s development, becoming it’s lead contributor.
To handle messaging SMOK uses RabbitMQ. Both the device’s communication go through it, device orders (eg. write a particular setpoint, read a particular temperature) and event notifications. Event notifications are to be delivered using either a mobile notification, an SMS or an e-mail.
Some other installable Python services
If you wanted to take a closer look about sending notifications, you might want to take a look at smok5/eventroute. Installable as a Python wheel, it equips your application with the capability to send notifications (SMS, e-mail, mobile), and seeing it as a compilable Docker image it’s the server to do such things. Of course it’s also compilable as a Sphinx docs).
HTTP API
Right now we run a couple of HTTP APIs. Some of these are earlier generation of services (SMOK4, using an ancient version of Python) that are no longer actively in development and that we’re looking forward to replace, but there’s a major HTTP API operating.
It’s available at https://api.smok.co . It’s the API – you can basically do anything through it. It’s written in Flask, since the data access layer is handled by smok5/core, and you don’t need to bring your own – a clear reason to use Flask instead of Django, which has an excellent ORM layer. It hosts it’s own documentation written in OpenAPI. Just visit the link, you’ll soon get the grasp on it. It’s of course heavily metricized, logged and traced.
The Holy Trinity of Observability
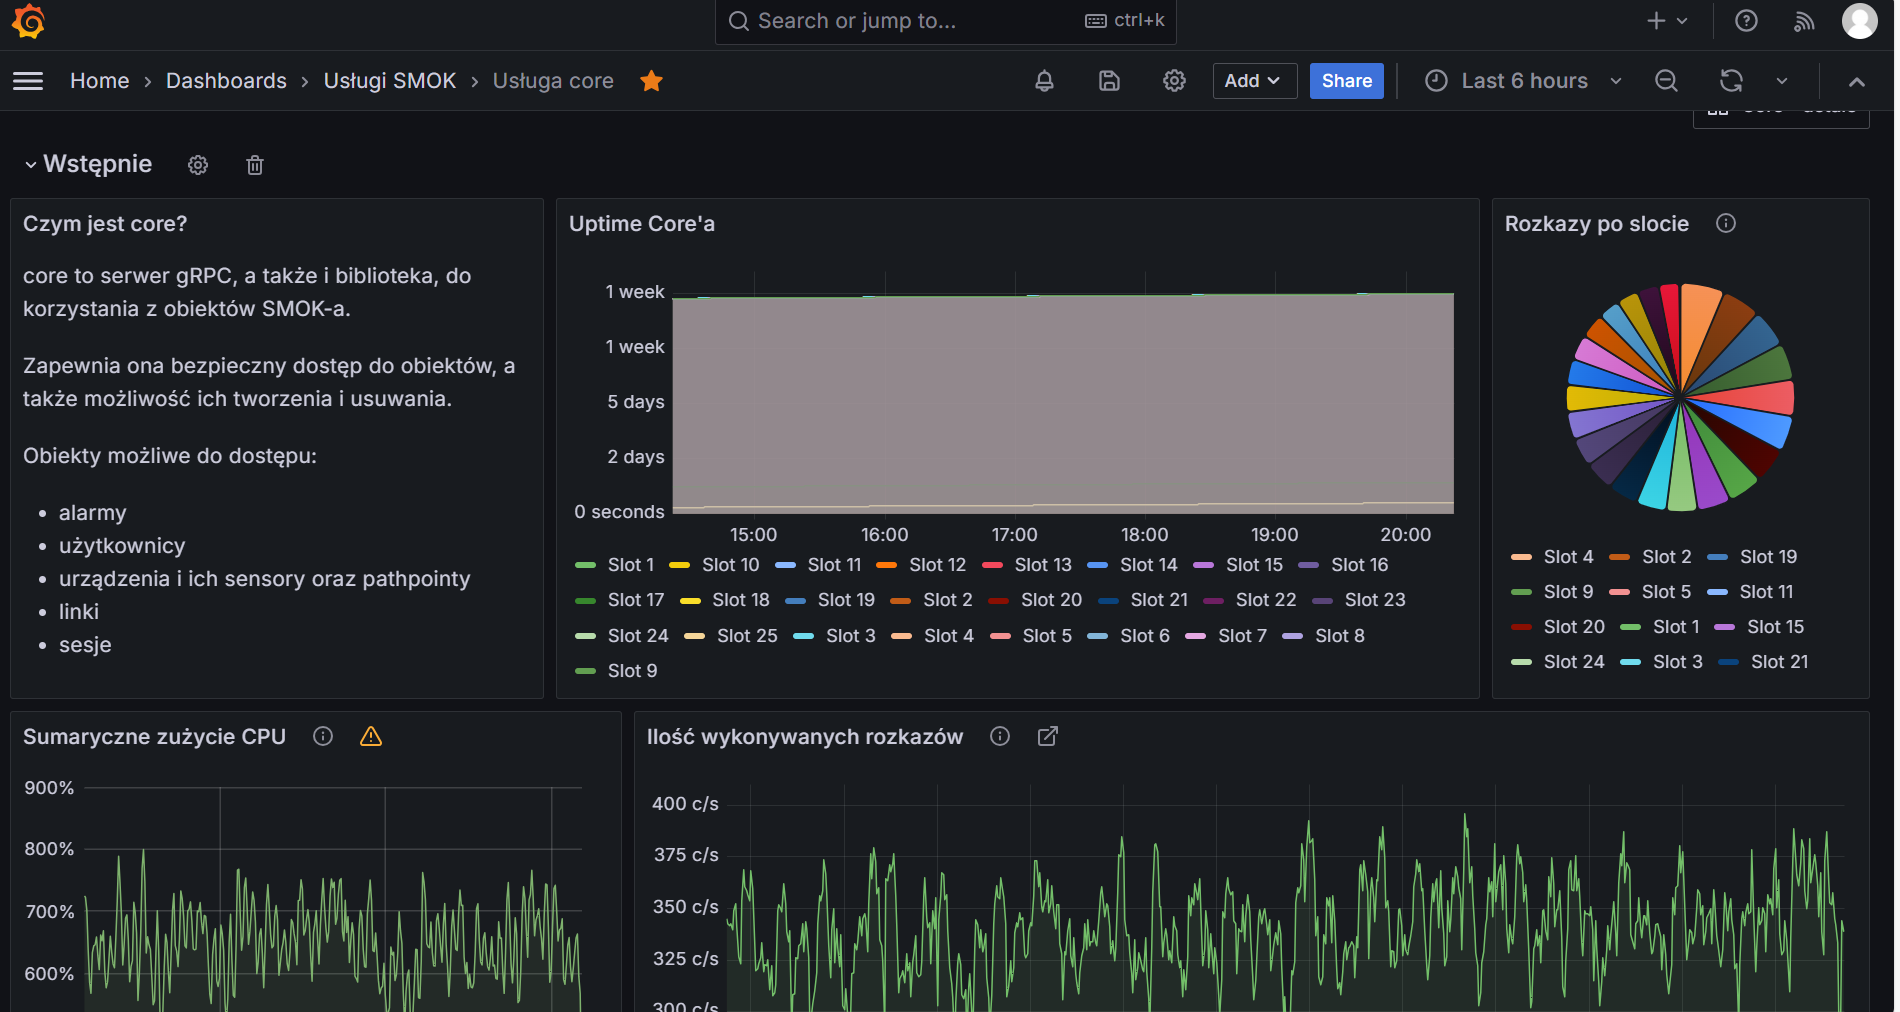
To implement observability we’re running following:
- Prometheus + Grafana for metrics. We do submit metrics using our in-house solution called satella. It’s a blast for metric support anyway, metric upload is done through smok5/runtime.
- Jaeger for tracing. It stores it’s data in a Cassandra instance, anyway, so we cut up on the database real estate significantly.
- Seq for logs. It’s a non-obvious solution, and I promptly forgot the reasons for it. We’ve invested in a Seq metrics export solution, so all of our observability tools are also monitored in turn.